
The Intelligent Hiring Platform
Journeyfront is the system that runs your hiring: intelligently, at scale, and in a way that gets smarter over time. Most ATSs give you tools to manage the process. Journeyfront uniquely brings together everything needed to execute it, learn from it, and make every future hire better than the last.

Source Top Talent Fast
High-volume hiring starts with a sourcing process that can keep up. Journeyfront connects every sourcing channel into one place so your team spends less time managing platforms and more time engaging the candidates who actually matter. The result: a faster-moving funnel with better visibility from day one.

Get to Your Best Candidates Sooner
Stop sorting through stacks of applications by hand. Journeyfront automatically screens for minimum requirements, ranks every candidate by your criteria, and surfaces your top applicants the moment they complete their application. Your best candidates are ready and waiting. All you have to do is engage them.
Never Let a Great Candidate Slip Through
Managing hundreds of candidates across multiple roles and locations is where great hires get lost. Journeyfront gives your team a single place to track every candidate, automate the repetitive work, and communicate at scale, so no one falls through the cracks.

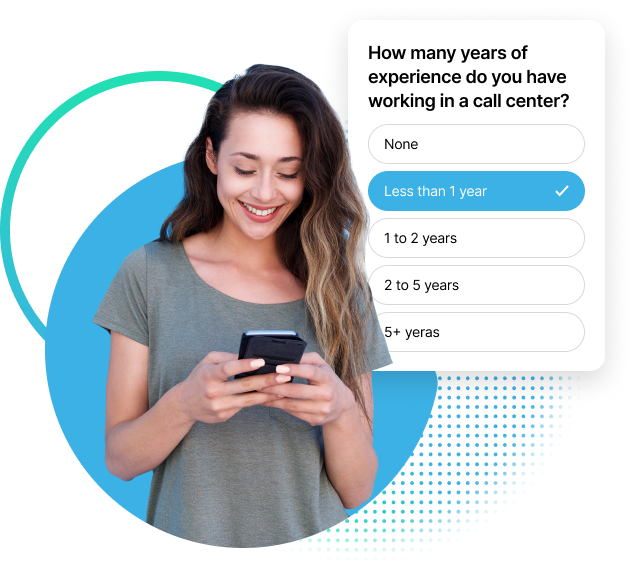
Assess and Predict Candidate Success
Resumes tell you what candidates have done. Journeyfront’s assessments tell you what they’ll do in your role. From job simulations to behavioral assessments to skills tests, our natively built suite gives hiring teams a fast, accurate signal on every candidate, customized to your company’s own data.

Run Better Interviews
Unstructured interviews produce inconsistent results. Journeyfront’s interview tools bring structure, consistency, and real-time feedback collection to every conversation, so your team spends less time coordinating and more time making great decisions.

Make Faster, Smarter Hiring Decisions
Every piece of data collected throughout your hiring process (assessments, interviews, notes, and scores) comes together in one unified scorecard. Compare candidates side by side, weigh the criteria that matter most, and make your final call with confidence.

The Last Mile of Hiring, Done Right.
Getting to an offer is only half the battle. Journeyfront keeps the momentum going: from sending a branded offer letter to collecting every signature and new hire document before day one. Automated triggers move candidates through the final steps without anyone having to chase them down. Fewer drop-offs. Faster starts.

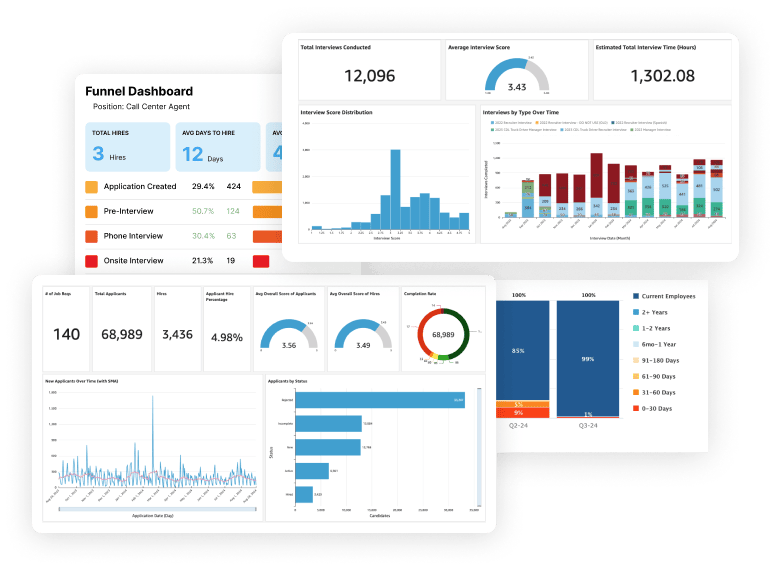
Turn Hiring Data Into Better Decisions
Most ATSs show you what happened. Journeyfront shows you why, and what to do about it. Built on a true data platform, our reporting suite connects every input in your hiring process to the outcomes that matter, so you can continuously improve the speed and quality of every hire.
Connect Your Entire Hiring Tech Stack
Journeyfront works with the tools you already rely on. With 400+ integrations and an open API, you can connect your HRIS, payroll, job boards, and custom systems, and keep all your hiring data flowing back to one place.
.png?width=779&height=559&name=integration-hero-img%20(1).png)
Ready to get started?

