Now more than ever, human resources teams are expected to create tangible value for the business—from hiring and retaining talent to performance management to leadership development and more. People analytics are key to helping HR teams meet the demands of today’s business landscape.
Why do people analytics matter?
Board members, CEOs, and other stakeholders are looking to HR to deliver actionable information and data-backed insights. In fact, 71% of companies worldwide view people analytics as a high priority because they recognize the need to leverage people data for a variety of business problems.  People analytics allow HR teams to strengthen their relationship with these stakeholders by providing transparency, answering workforce questions strategically, and aligning decisions to business outcomes. In this blog post, we’ll outline the top two people analytics metrics that HR teams can use to report on and improve on retention and performance.
Metric #1: Turnover by Hiring Cohort
Reducing turnover is good, but preventing turnover from happening in the first place is even better—especially in a tight labor market. In scarcer conditions like these, replacing employees becomes even more costly for a company.
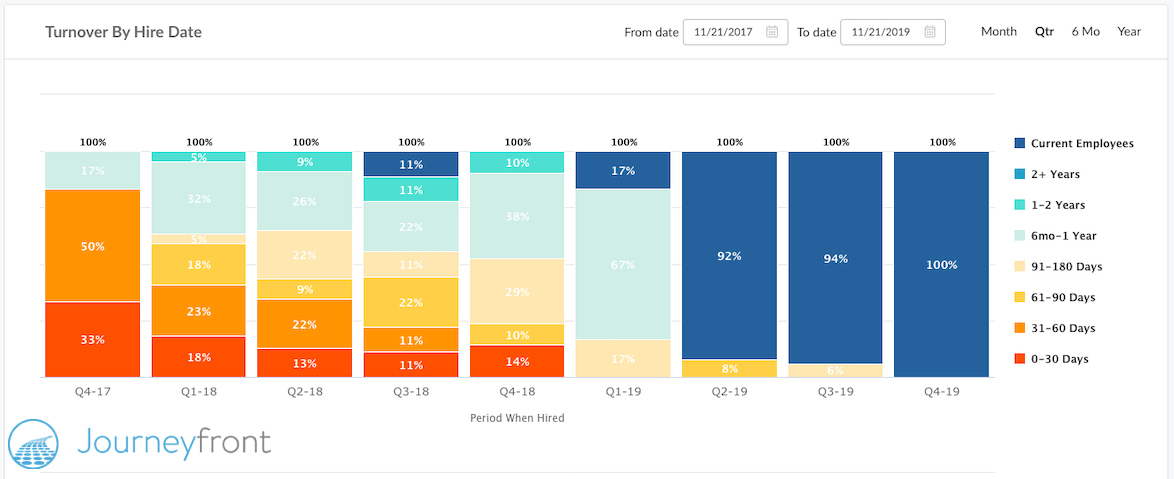
Preventing turnover starts with hiring, so it’s critical to understand how successful your hiring has been through retention data. Analyzing turnover by hiring cohort can provide key insights into retention and your hiring process. As you track these numbers over time, you’ll be able to analyze the effectiveness of any tweaks to your hiring process, as well as related efforts like employee development programs, culture initiatives, etc.
When you measure turnover by hiring cohort, it’s important to look at your data from multiple angles and measure both time retained by percentage as well as by raw numbers, as shown in the chart below: Combining these viewpoints can give you a more complete understanding of your data—and therefore, of your organization’s retention efforts.
Metric #2: Employee Performance by Hiring Cohort
The second metric you’ll want to look at is employee performance by hiring cohort—after all, retention is irrelevant if the employees don’t succeed in their roles.
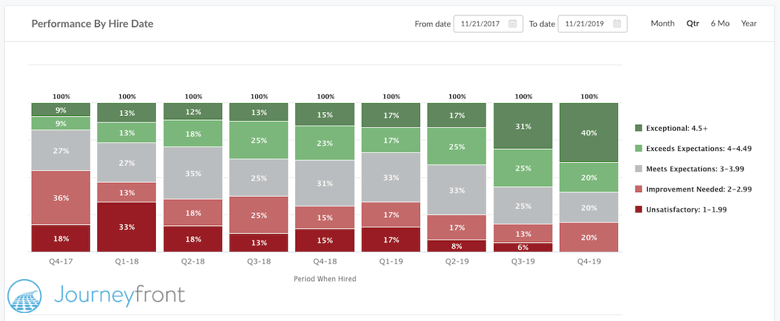
So why measure performance by hiring cohort? Each cohort you hire may have a different experience, or you may choose to hire differently, as you make adjustments to your hiring process. Analyzing performance by cohort allows you to see how those changes are impacting your team’s results.
As with turnover, we recommend looking at performance both by percentage and raw numbers as shown below: How to Create Performance and Turnover Metrics
When it comes to creating reports, spreadsheets are always an option, but they’re not particularly compelling. On the other hand, using software to create distinctive data visualizations allow for greater storytelling and engagement.
A 2015 study demonstrated that visual data representation was linked with increased attention, better recall, and higher likelihood of support by managers. If you’re concerned with demonstrating your team’s value to stakeholders with data—including providing transparency, answering workforce questions, and making better decisions—a visual impact is invaluable.
Software tools like Tableau and Grow.com are great resources for building your own data visualizations. If you’d rather have these charts created for you automatically, check out Journeyfront.


